Critiquing a visual's clarity
- Dissected original design brief from the "1 Forecast" team
- Noted questions the team can ask themselves that better articulate what they wished to communicate
- Showed them how I might handle this if I were in their shoes
Impacts
- Team adjusted the design based on my feedback
- Built some relational equity with this team as someone who cares more about the intent of a deliverable and less on the aesthetics
Summary
A User Researcher from another team approached me for my feedback on a visual her team created. It would be for the CEO and the executive team to see and be influenced by some of the challenges it highlighted.
The goal of the visual was to display how well the forecasts were performing compared to actual results within the Supply Chain org. The 1 Forecast team were not confident their current visual was truly communicating what they intended.
Taking in what's been done
The Supply Chain team set up time with me and a few other Designers and Researchers from separate teams to capture initial feedback on the clarity of their visual & how well it aligns to their expected goal.
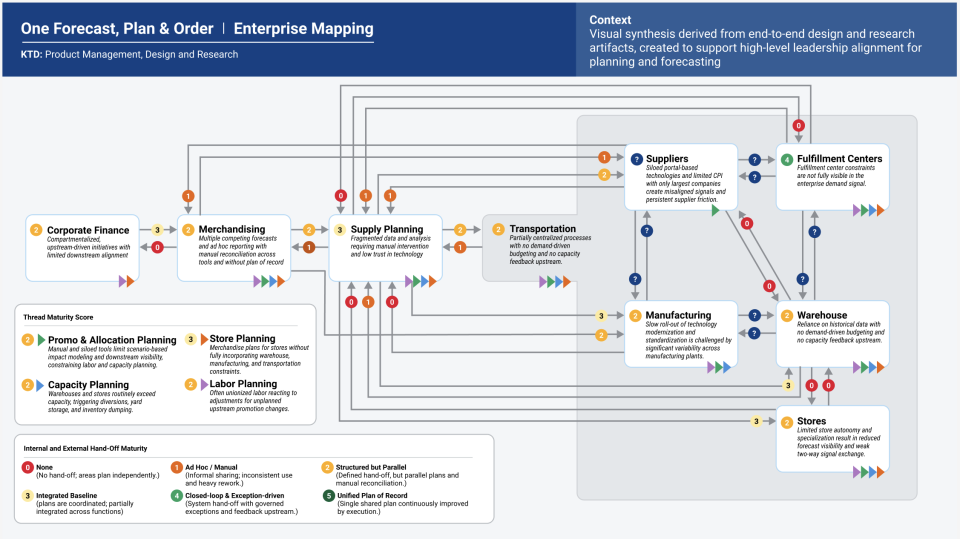
During that meeting, several of the participants gave feedback on the seemingly obvious visual errors, like:
- "there are too many colors"
- "the connecting lines are too thick" and
- "the icons & numbers crowd the available space & are confusing," etc.
So rather than staying on that aesthetic train, I chose to share feedback that reaffirmed the intent of the visual & helped them assess whether they were achieving its purpose or not.
Marking up the page
After that feedback session, I went to work in a separate mural... taking in the design brief they shared to begin noting down what I was seeing & interpreting from it. I was hoping that the 1 Forecast team would benefit from seeing how I might approach the request if I were in their shoes.
I sensed they were a bit deflated by the end of that feedback meeting, because the visual elicited so many surface-level reactions from participants, and that's why I started with the design brief...NOT THE VISUAL.
The design brief said:
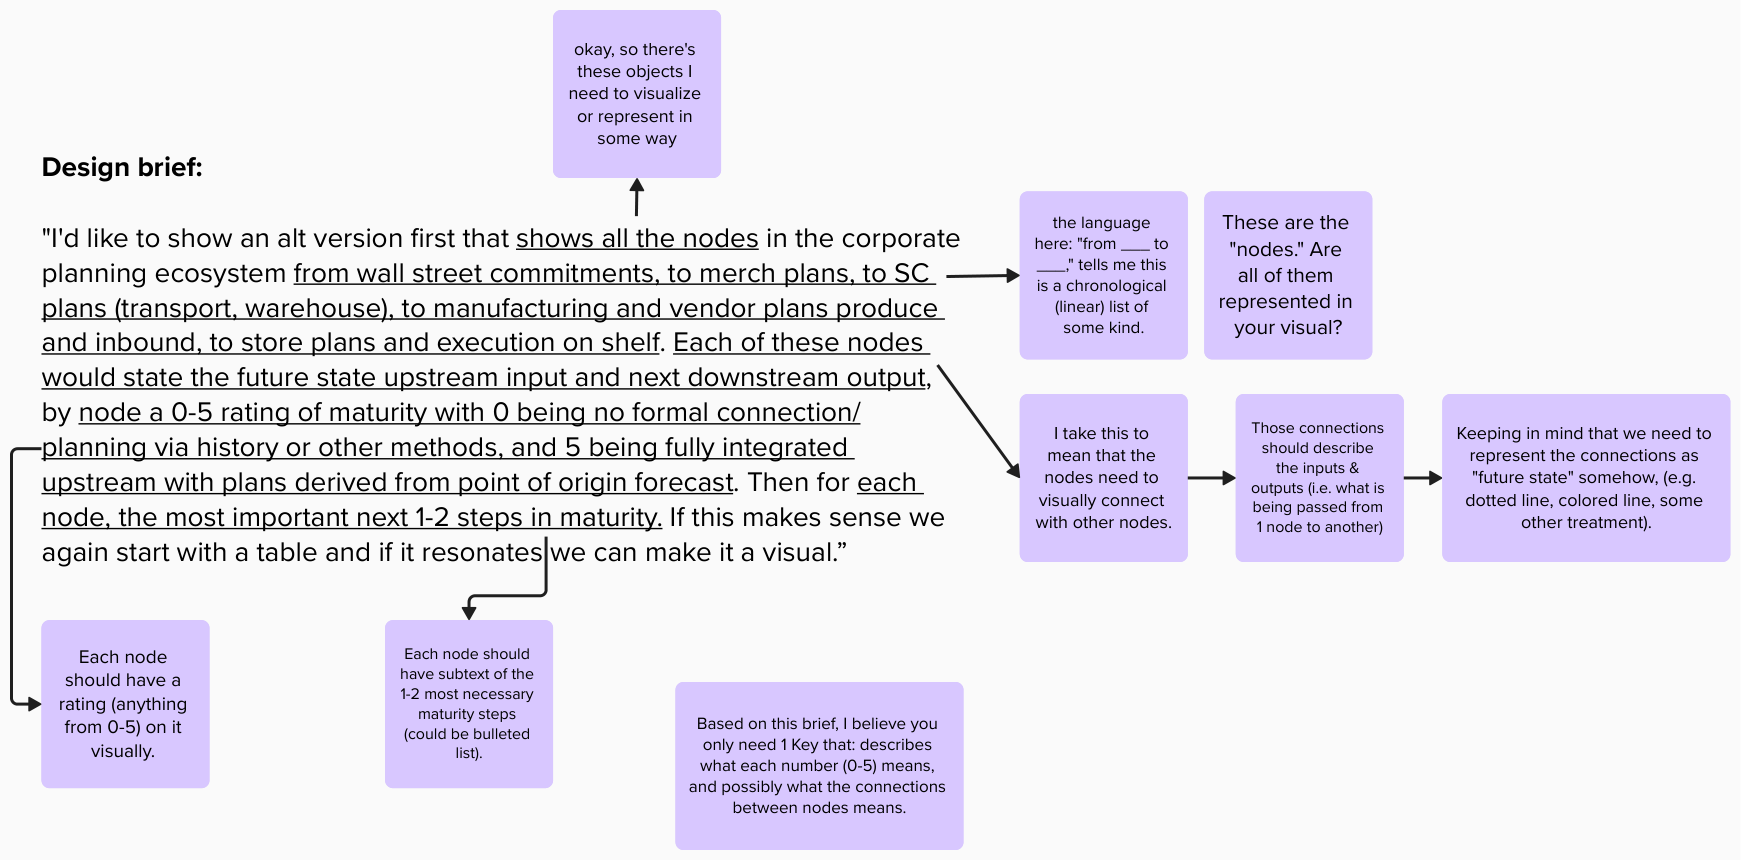
"I'd like to show an alt version first that shows all the nodes in the corporate planning ecosystem from Wall Street commitments, to Merchandising plans, to Supply Chain plans, to Manufacturing and Vendor plans ... and inbound, to Store plans and execution on shelf. Each of these nodes would state the future state upstream input and next downstream output, by node a 0-5 rating of maturity with 0 being no formal connection/planning via history or other methods, and 5 being fully integrated upstream with plans derived from point of origin forecast. Then for each node, the most important next 1-2 steps in maturity."
In most of these cases with briefs, I started by reading through it multiple times to get the whole context and story it was trying to tell.
From there, I broke down each of the sentences to extract what I believe needs to be visualized & in what possible ways. My thoughts were expressed as notes for the team to learn from:
- "Okay, so there's these objects I need to visualize or represent in some way."
- "The language: 'from _____ to _____ ,' tells me this is a chronological list of some kind."
- "The nodes need to visually connect to other nodes."
- "The connections should describe the inputs & outputs."
- "Keeping in mind that we need to represent the connections as 'future-state' somehow, e.g. dotted line, colored line, or some other treatment."
At the same time, lots of questions came up for me since I wasn't super familiar with this subject matter or that I wanted the team to ask themselves certain things once they regrouped:
- Q: "Are all nodes mentioned in the brief also represented in the visual? If they aren't shown, why are they kept out?"
- Q: "Where do you want the audience to look first? Then where? How about after that?"
- Q: "Does this need to be 1 visual? Can it be more than 1?"
- Q: "What can we simplify, if anything? What visual noise might be present?"
- Q: "What does 'good' look like here?"
And knowing this would be seen by the CEO, I believed the name of the game was all about "quick clarity." How fast could he grasp what he was seeing? Was it clear enough to produce the desired outcome the 1 Forecast team was looking for?
Sketching a testable (& passable) visual
In taking down the notes and questions previously, I sketched out a very dirty map for the team to react to and to share with other SMEs outside of our initial discussion.
Here's what I tweaked:
I gave the visual a clear title of what the viewer should expect is represented there, a linear flow of nodes with rating circles for maturity levels, every node having at least 2 next steps to improving its maturity, and a simple key describing what each rating meant.
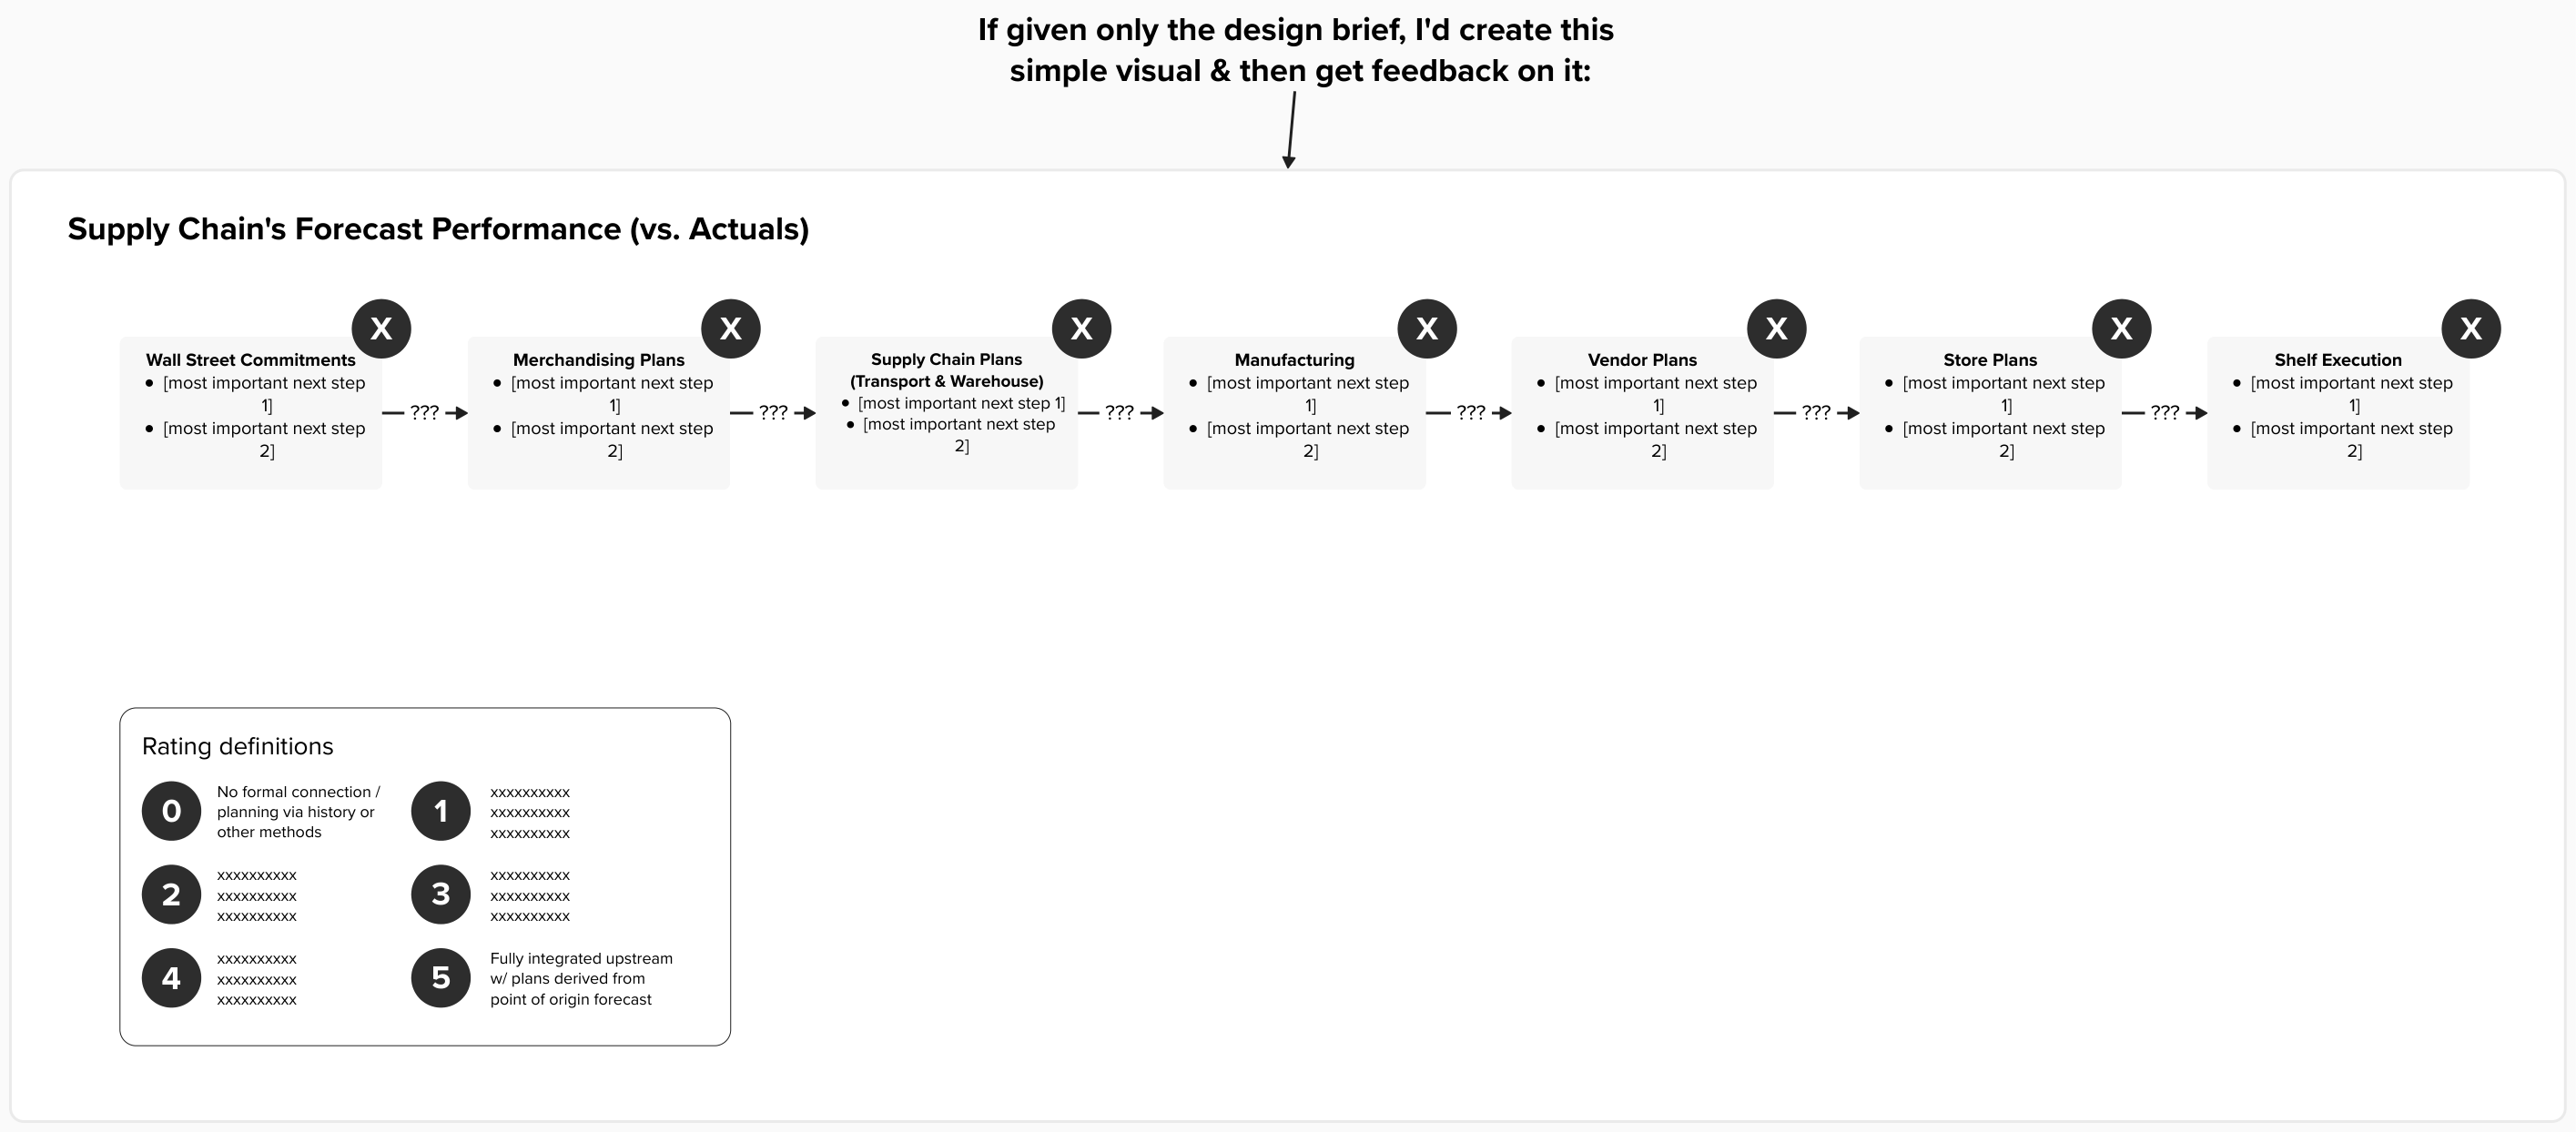
What's great about this approach is that it took me less than an hour to do, and the team was grateful I gave them the feedback they were looking for (+ more) based on their original ask.
Reach out if you'd like to learn more about this case study.